Visualization and Interaction
Plotting variable sensitivities
Sensitivities are a useful way to evaluate the tradeoffs in your model, as well as what aspects of the model are driving the solution and should be examined. To help with this, gpkit.interactive has an automatic sensitivity plotting function that can be accessed as follows:
from gpkit.interactive.plotting import sensitivity_plot
sensitivity_plot(m)
Which produces the following plot:
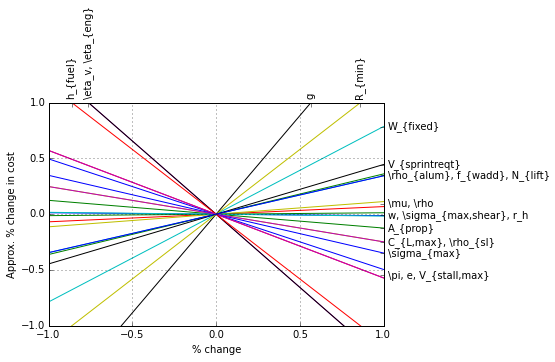
In this plot, steep lines that go up to the right are variables whose increase sharply increases (makes worse) the objective. Steep lines going down to the right are variables whose increase sharply decreases (improves) the objective. Only local sensitivities are displayed, so the lines are optimistic: the real effect of changing parameters may lead to higher costs than shown.